
About Brillminds
Brillminds Technologies is a leading provider of web development, digital solutions, cloud services, AI development, and software development. We specialize in delivering innovative IT consulting services to help businesses thrive in the digital age.
Find Us Our Location
- Headquarter: Hyderabad, India
- info@brillminds.com
- (+91) 9014 777 627

Business Intelligence Dashboards
Business Intelligence Dashboards
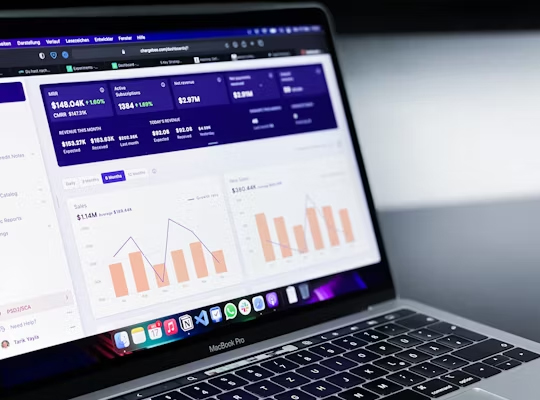
At Brillminds, we develop powerful Business Intelligence (BI) dashboards that enable organizations to visualize, analyze, and act on data effectively. Our solutions help businesses unlock insights, monitor key metrics, and make data-driven decisions with confidence.
What We Offer
Interactive BI dashboards that turn complex data into actionable insights for smarter decisions.
We design and deliver custom BI dashboards that consolidate data from multiple sources, provide real-time analytics, and present information in an intuitive, visually engaging format — empowering decision-makers to act quickly and strategically.


Data Integration
Connect multiple data sources, including ERPs, CRMs, and databases, for a unified view.

Visualizations & Reporting
Interactive charts, graphs, and reports for easy interpretation of complex data.

Predictive & Advanced Analytics
Leverage AI and machine learning for forecasting trends and identifying opportunities.


Why Choose Brillminds?
Your Trusted BI Partner
-
Proven Expertise
Extensive experience building BI solutions across industries and departments.
-
Agile Development
Iterative, flexible approach for timely delivery and continuous improvement.
-
Future-Ready Platforms
Designed to empower teams to make smarter, faster, and data-driven decisions.
BI Dashboard Capabilities
From self-service reporting to executive dashboards to embedded analytics in your product -- we build BI that business teams actually use.
Power BI and Tableau
Professional Power BI and Tableau dashboard development -- data modelling, calculated measures, interactive visuals, row-level security, and scheduled refresh -- deployed to your existing Microsoft or Tableau environments.
Custom Dashboard Development
React-based custom dashboards with charts (Recharts, D3, Highcharts), real-time data connections, filter and drill-down capabilities, and pixel-perfect design -- for when standard BI tools cannot meet your requirements.
Embedded Analytics
BI dashboards embedded directly in your SaaS product or web application -- giving your customers access to their own analytics without leaving your platform. Built on Metabase, Apache Superset, or fully custom implementations.
Frequently Asked Questions
When should I use Power BI vs a custom dashboard?
Use Power BI (or Tableau) when your users are business analysts comfortable with BI tools, when you need self-service reporting capabilities, and when your data fits standard dimensional modelling. Build a custom dashboard when you need specific UI/UX, real-time data (Power BI refresh cycles may not be fast enough), embedding in another application, or highly custom visualisations that BI tools cannot produce.
How do you connect dashboards to our data sources?
We connect to databases (PostgreSQL, SQL Server, MySQL, BigQuery, Snowflake), REST APIs, file exports (CSV, Excel), and cloud services. For Power BI, we build Power Query M scripts or use DirectQuery connections. For custom dashboards, we build dedicated API endpoints or use data warehouse query layers.
What is row-level security and do I need it?
Row-level security means different users see different subsets of data based on their role or identity. You need it when different business units, customers, or roles should only see their own data -- for example, regional managers seeing only their region's sales data. We implement RLS in Power BI using DAX filter rules and in custom dashboards using query-level filters.
How long does a BI project take?
A focused dashboard connecting to 1-2 data sources with 5-10 key metrics typically takes 4-8 weeks. A full BI platform with data warehouse, multiple data sources, and a library of dashboards typically takes 3-5 months.
How We Work
Every Brillminds engagement follows a structured process that reduces risk, keeps scope under control, and delivers working software on a committed schedule.
Discovery Sprint
2 weeks. We define scope, architecture, and user journeys, and deliver a fixed-price quote for the full build.
Design
UI/UX design, prototyping, and stakeholder sign-off before engineering begins. Changes in design are cheap; changes after coding is not.
Agile Build
2-week sprints. Working software released at the end of every sprint. Transparent progress, no surprises at the end of the project.
Launch and Support
Deployment, knowledge transfer, and optional post-launch retainer. Full IP transfer at handover. You own everything.
BI Dashboards For
Brillminds has delivered projects across sales teams, operations and supply chain, finance and executive leadership, HR and talent, and customer success teams. If you are looking for a trusted engineering partner with proven domain experience, book a free strategy call.
Get Started Today
Ready to transform your data into actionable insights? Contact Brillminds to discuss your Business Intelligence dashboard needs. Let’s empower your organization with smarter, real-time decision-making!